Projects
SerpVive
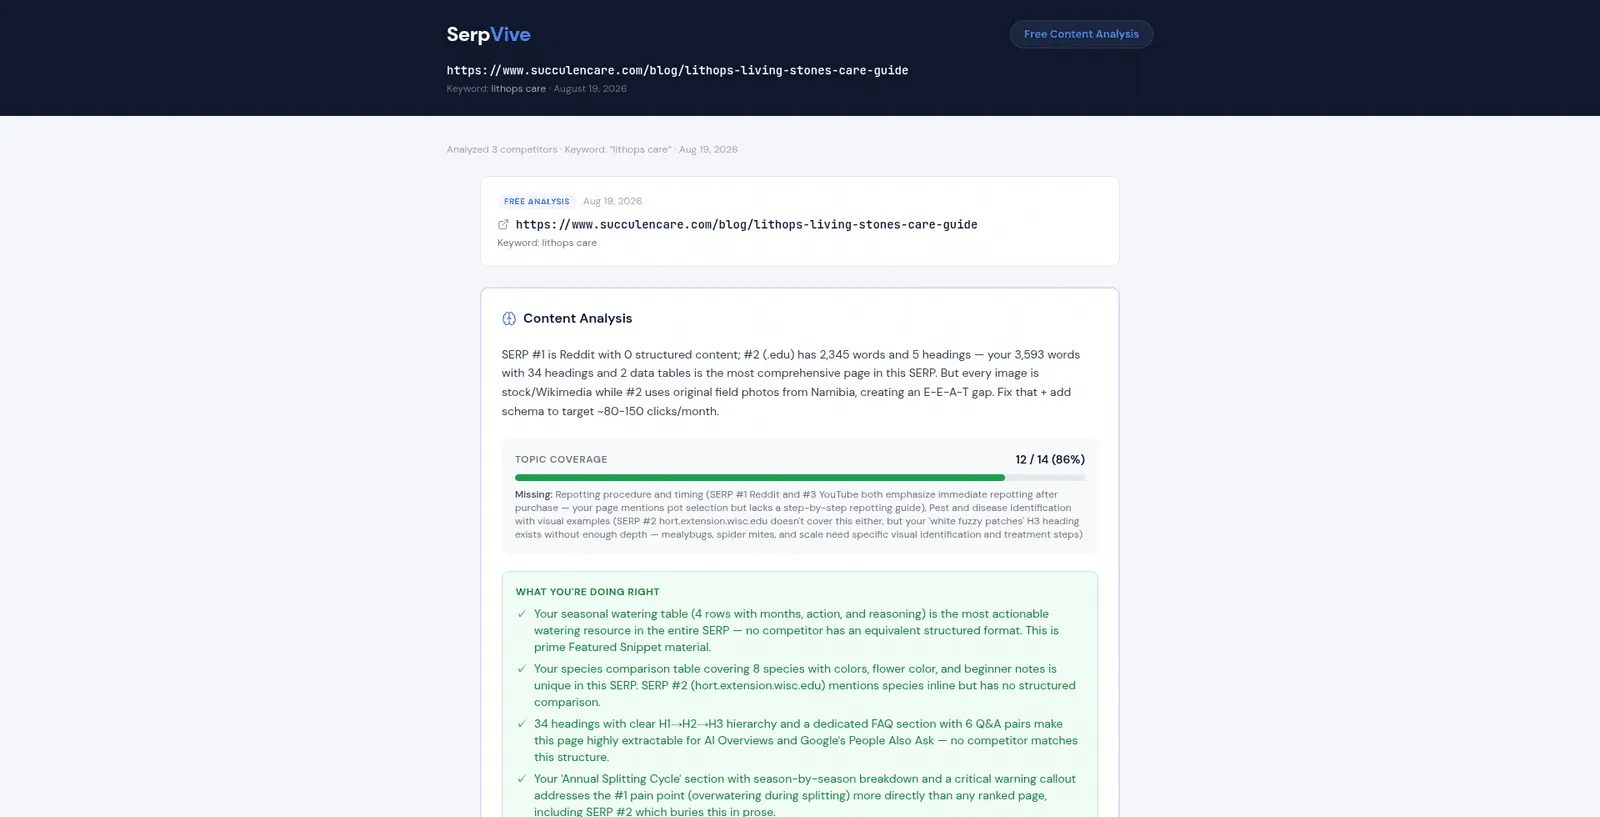
A content decay monitor for blogs. It connects to Google Search Console, detects which pages are losing organic traffic using a deterministic scoring engine, and then — only for the one step that genuinely needs judgement — uses a language model to diagnose why, grounded in the live search results and the page’s actual content.
Source on GitHub · Next.js, TypeScript, PostgreSQL/Supabase, Vercel · Paused since April 2026
The problem, and where I drew the line
Bloggers and SEO consultants find decaying content by exporting Search Console data into spreadsheets and eyeballing the deltas, page by page, month after month. That work splits cleanly in two:
- Detection is arithmetic. Which pages are down, by how much, and how fast. Software should just do this.
- Diagnosis is judgement. “Why did this page lose its ranking?” requires comparing the page against what currently outranks it.
SerpVive is built along that seam. Detection is free, instant and reproducible. Diagnosis costs real money and takes minutes. Keeping them separate is what makes the product viable rather than a wrapper that bills an LLM call for subtraction.
The scoring engine is deterministic on purpose
Everything in src/lib/engine/ is pure arithmetic. No model is involved at any
point.
Decay score — (peak_clicks − current_clicks) / peak_clicks × 100, where
peak is the highest monthly click total in a 16-month window and current is
the sum of the last 28 days.
Velocity, at two resolutions — velocity_7d compares this week against last
week, velocity_28d compares the last 28 days against the 28 before that.
Positive means declining. One catches a cliff, the other catches a slide.
Seasonality check — the current 28-day window is compared against the same window one year earlier. If the ratio sits within ±20%, the page is flagged seasonal rather than decaying. This exists to kill a specific false positive: a page that predictably dips every year is not dying.
Noise filter — if the peak is under 10 monthly clicks, the score is forced to zero. Without it, a page going from 3 clicks to 1 reports as a 67% collapse and drowns the signal. A page that is growing scores zero too.
Why no LLM here. The project has an explicit rule, written into its
CLAUDE.md before the first line of application code: never use a language
model where deterministic math works. The model is reserved for the single step
that cannot be computed — explaining why a page is losing, given the SERP, the
competitors’ content and the page itself. That boundary is the main design
decision in the whole system, and it is the reason detection can run on every
page of every site continuously while diagnosis stays a deliberate, budgeted
action.
A four-provider failover chain across three external APIs
Diagnosis calls run through a chain of four models spanning three separate providers. The ordering is not arbitrary — it escalates by blast radius, from the cheap fix to the full infrastructure swap:
flowchart TD
    START([Diagnosis request]) --> KILL{AI_DISABLED?}
    KILL -->|yes| STOP([AiDisabledError])
    KILL -->|no| CAP{Under spend cap?}
    CAP -->|no| CAPSTOP([AiSpendCapExceededError])
    CAP -->|yes| P1

    P1["1 · Claude Opus 5<br/>Anthropic"] -->|success| DONE([Diagnosis returned])
    P1 -->|"timeout 120s / error"| P2
    P2["2 · Claude Sonnet 5<br/>Anthropic — rate limits only"] -->|success| DONE
    P2 -->|fail| P3
    P3["3 · Gemini 3.7 Flash<br/>Google — survives an outage"] -->|success| DONE
    P3 -->|fail| P4
    P4["4 · GPT-5.6 Terra<br/>OpenAI — third infrastructure"] -->|success| DONE
    P4 -->|fail| EXHAUSTED([FallbackExhaustedError<br/>+ full attempt log])
Three mechanics make it work:
- A 120-second timeout per attempt, raced against the provider call. A hung provider cannot stall the chain.
- No retry on the same provider.
RETRY_SAME_PROVIDER = 0— on failure the chain moves on immediately. Retrying might recover a transient blip, but it doubles worst-case latency on an already slow pipeline for an uncertain payoff, when the next link is a known-good alternative. - Permanent errors skip ahead. Auth failures, invalid keys and billing errors are classified as non-retryable and break out immediately instead of burning the retry budget on something that cannot succeed.
Both levels have fired in production. One diagnosis of eleven completed on
Sonnet after Opus failed — a same-provider fallback. Separately, Gemini hit its
API quota mid-brief and the chain fell through to OpenAI and completed. The
design was not theoretical; it is load-bearing, and the model_used column and
pipeline logs are where those two episodes are recorded.
A pipeline that expects malformed output
Language models return broken JSON in predictable ways, so the pipeline repairs
before it rejects. Every step below is a real branch in json-extract.ts and
diagnose.ts:
flowchart TD
    RAW([Raw model response]) --> S1

    subgraph EXTRACT["1 · Extract and repair — json-extract.ts"]
        direction TB
        S1[Strip markdown fences] --> S2[Slice to outermost braces]
        S2 --> P1{Parses?}
        P1 -->|no| S4[Escape newlines<br/>drop trailing commas]
        S4 --> P2{Parses?}
        P2 -->|no| S6[Close unbalanced brackets]
        S6 --> P3{Parses?}
    end

    P1 -->|yes| PRE
    P2 -->|yes| PRE
    P3 -->|yes| PRE
    P3 -->|no| FAIL([Unrecoverable])

    PRE["2 · Truncate to 5 causes"] --> ZOD{"3 · Zod validation"}
    ZOD -->|valid| STORE([Diagnosis stored])
    ZOD -->|invalid| RETRY["4 · Error-informed retry"]
    RETRY --> ZOD2{Valid now?}
    ZOD2 -->|yes| STORE
    ZOD2 -->|no| GIVEUP([Reject])
The retry is worth singling out. It does not simply ask again — it hands the model back its own broken output together with the precise validation errors. And the pre-validation truncation exists because a model returning six good causes when the schema allows five is not a failure worth paying for a second call to fix.
Untrusted input is sanitised on the way in. Scraped pages, competitor
content and Search Console queries all pass through sanitize.ts before they
reach a prompt, and model output is sanitised for XSS vectors before it is
stored or rendered. The honest provenance: this was not foresight. A security
audit flagged unsanitised external content in prompts as the top vulnerability —
a competitor could embed hidden instructions in their own HTML — and the module
is the fix.
Schema and data
- 13 tables in PostgreSQL (Supabase), with row-level security on every one. The service role used by crons and webhooks bypasses RLS deliberately; everything user-facing goes through it.
- 30 versioned SQL migrations, applied in filename order.
- 42,784 Search Console query rows ingested, across 188 real monitored
pages. One site alone accounts for roughly 22,000 rows in
page_queries.
Instrumentation and cost control
Every AI call logs tokens_input, tokens_output, cost_usd and
processing_time_ms to the database. That is not decoration — it is the input
to three controls:
- A global spend ceiling.
AI_SPEND_CAP_USDsums recorded cost across diagnoses, external analyses and demos and refuses new calls past the limit. It is deliberately approximate, because a run’s cost is only known once it finishes, and deliberately fails open: if the lookup errors, the call proceeds. A budget guard that becomes a single point of failure has traded a few dollars for an outage. - A single kill switch.
AI_DISABLEDstops every AI call at the one funnel they all pass through, leaving the dashboard, ingestion, scoring and email untouched. - An inactivity policy that bounds data growth. An abandoned account keeps
ingesting Search Console data forever; the API is free but Postgres is not
infinite. Accounts nobody has opened in 60 days move to a
dormantstatus and the daily cron skips them. Logging back in reactivates them automatically — nothing to request, nothing deleted.
The measured numbers above come from the previous model generation (Opus 4.6 / Sonnet 4.6): 11 production diagnoses, $0.2177 average cost per diagnosis, ~213 s average end-to-end latency. The chain now points at the current generation and has not been re-measured. The latency is not a request-response path — a diagnosis searches Google live, crawls the page plus up to three ranking competitors, and generates up to 8,192 output tokens before validation.
The decision I defend most
The architecture and the complete SQL schema were specified before the first line of application code. The initial commit contains eleven project documents — product spec, architecture with the full schema, scope, backend algorithms, design system — and no features. The stack was then locked against drift by an explicit instruction never to substitute alternatives unasked.
Over 300+ commits later, the system still matches its day-one architecture document. That is the claim I would most want tested, and it is the one most easily checked: the first commit is in the history, and so is everything since.
On how it was built
Built with heavy AI assistance, before I decided to learn properly. It works, it runs unattended in production, and the decision to keep it here is part of the story.
Because every commit was a pair session, the git history cannot separate a human-typed line from a model-generated one, and I will not pretend otherwise. What I can defend is every decision on this page — each has a reason I can reconstruct, and several exist only because something broke in production and had to be understood.
What is not done
No automated tests and no CI — the project’s biggest gap. No paying users. Monetisation is integrated and switched off. Alerting is detected and logged but never delivered: the product finds decay and does not tell you. The quality of the diagnoses has never been systematically evaluated. These are listed in full, with what I would do first about each, in the repository README.